
Section 1: Exploratory Data Analysis
- Number of Respondents From Each Province

Regional disparities in educational infrastructure and funding across Indonesia can significantly influence a student’s exposure to and literacy in AI. The choropleth map above illustrates the provincial distribution of our survey participants, with the varying density of the blue overlays corresponding to the total number of respondents from each area.
The educational backgrounds of Indonesian students can vary based on province, leading to differences in AI literacy. Examining the provincial representations in this map, differences between the total number of respondents from each province is clearly shown. We can see that many respondents are from the Sumatera Barat province, followed by Yogyakarta Special Region and North Sumatera. This visualization shows us that there is an unequal representation of Indonesian provinces in our student survey dataset. This necessitates province-level analysis, as the student perceptions we explore in our analysis can be affected by provincial differences in education fundings, upbringings, and student backgrounds. This map, which allows us to get an overview of how many respondents, lets us complement provincial differences with our analysis of student perceptions on AI usage.
2. Number of Respondents from Each Field of Study
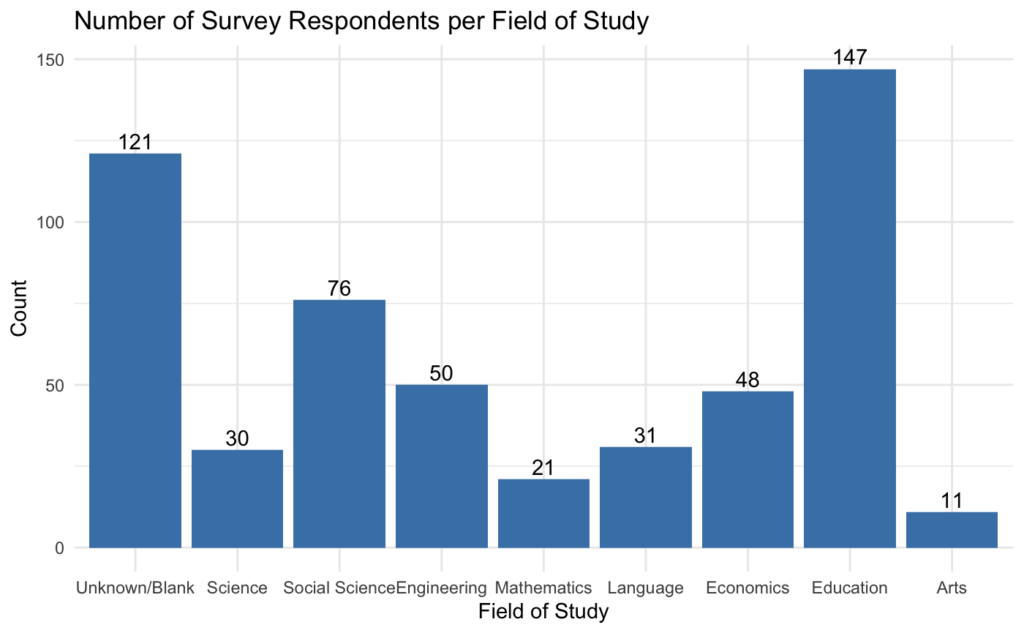
The bar chart above visually displays the count of survey respondents in each of the 8 academic categories, as well as to illustrate which categories, if any, are over or underrepresented in the dataset. From this barchart, we can see that the most common academic category among the survey respondents was those who are pursuing a career in Education, with 147 survey respondents making that selection. Conversely, subjects like Mathematics and Arts are underrepresented, with 21 and 11 survey respondents making those selections respectively. Finally, there is a significant number of respondents who either did not fill out the questions, did not identify themselves, or did not feel as though their degree was represented in the answer choices.
In the context of our project, this gives some interesting and relevant insight into how the respondents might respond. With such a high number of Education students, and given that this is a survey about educational outcomes and use of AI in educational settings, it is possible that the results tend towards one side or the other. In addition, because such a large proportion of respondents have unknown academic fields of study, it is hard to attribute any trends in their responses towards a specific category, or to truly know if this is the distribution of fields.
3. Bubble Chart of Types of AI Utilized

The bubble chart above shows that an overwhelming majority of students in our dataset use ChatGPT, followed by Canva AI and Perplexity AI. On the other hand, AI tools like Shutterstock AI, Tome.app, Gamma, and Eduten are the least popular within our dataset. This can be due to multiple factors, such as geographical and infrastructural factors, students’ familiarity, the services these tools offer, and more. In general, this visualization highlights how only a small number of AI tools are dominating students’ AI usage in academic settings.
In addition, the data reflects the broader growth of AI tools in education over the past few years. AI-powered tools such as Eduten and DeepL have existed long before 2022. However, the public release of AI conversational models (chatbots) has made integrating AI in academics significantly easier for students. AI chatbots like ChatGPT, Perplexity.AI, and Microsoft’s Bing introduced an interactive approach that was more appealing to students. Thus, such recent and adaptable applications dominated students’ usage patterns, while the earlier task-specific tools are used less frequently. As Kasneci et al. explain, large language models can support activities such as creating educational content, solving complex problems, and providing explanations to assist student learning. This helps explain why ChatGPT dominates the responses in our dataset, while the more specialized applications appear less frequently. Developing AI literacy is important for understanding the capabilities and limitations of such models (Kasneci et al. 2023).
It is also worth noting that geographical and internet infrastructural factors may influence which AI tools students use. For example, no information was found about when Eduten became available in Indonesia or when Indonesian-language support was made available on the website. This may help explain why only a few students are using it in their studies. Internet infrastructure can also limit students, as those with less reliable internet access might have to rely on fewer tools to support all their educational needs.
In the context of our project, this bubble chart helps us gain a better understanding of the most and least popular AI tools used by the sample of Indonesian students in our dataset. Since the most-used AI tools were designed to perform a wide range of tasks, this can reflect students’ preference for efficiency when summarizing class notes, asking for explanations, or answering homework. Understanding how students use these large language models is essential as AI continues to grow within higher education.
4. Number/Percentage of students using types of AI in each field

This heatmap provides intuitive visual navigation of the number of students for every single possible combination of specific fields of study and the specific AI tools used. The color gradients are included to show where are the most concentrations when it comes to the number of students using particular AI in different fields of study (with dark green being the highest number of students and grey being the lowest number of students).

We also have the same heatmap but in percentages of how many percent of students in each field are using the specific AI tools due to the number of students not being evenly distributed across different fields of study.
Across every field of study, ChatGPT dominates in number one most used AI with percentages ranging from 38.10% to 54.55%. ChatGPT remains widely adopted across every field of study, with Arts students using ChatGPT the most followed by Canva, which is expected by Canva providing a creative visual platform. Over 50% of Education, Social Science, Engineering, and Natural Science students also use ChatGPT. With Economics students, 45.83% of students still use ChatGPT, but their second most popular AI tool is Perplexity at 20.83%. Language and Mathematics had the least percentage of students using ChatGPT with 38.71% and 38.10% respectively. It could be due to the general LLM ChatGPT not being fully capable in supporting their specialized fields of study such as writing essays in their own words, learning a secondary language, or solving complicated mathematical problems. Avid AI users in the Language and Mathematics field may be more likely to seek out specialized AI in their fields. 18% of Engineering students reported using other types of AI not listed in the questionnaires. More future research could be done on which specialized tools the students in respective fields prefer when studying their major-related subjects.
Section 2: Section Analysis
Performance Expectations
The first section of the chart is the Performance Expectations Section, which asks users 20 questions on how they expect AI to perform in various different settings, from creative applications to coding. The black dots represent populous cities in Indonesia, with larger dots representing a larger population. For this section, we chose to analyze three questions that were most relevant to our central research question:
- The use of AI helps me access various sources of information relevant to my course, especially for academic assignments and understanding course materials.
- The integration of AI in learning prepares me for the demands of an increasingly digitalized job market.
- The use of AI helps me access learning materials that are tailored to my learning style, providing more detailed explanations and leading to better retention of information.
Since our topic is focused on educational outcomes, these three questions relate more directly to the integration of AI into educational settings and the students’ perceptions of its performance in helping them learn better and become more prepared for a future job.
As seen in the figure above, the mean scores for performance evaluation questions for the provinces that do have respondents ranges from 2.17 to 3.46. The Likert scale only runs from 1 to 4, with 1 being Strongly Disagree and 4 being Strongly Agree. The provinces of Jakarta Raya (3.46), Papua (3.36), and Riau (3.16) have relatively higher mean scores on the performance evaluation questions, suggesting that university students in these regions may be more amenable to the idea of integrating AI into their classrooms and believe that it positively impacts their learning outcomes. On the other hand, regions such as Aceh (2.17) and Kalimantan Tengah (2.66) have relatively lower mean scores, which can indicate certain reservations about the use of AI systems within their classrooms.
Such results are in line with our hypothesis for student expectations, as we predicted that university students may be more excited about the capabilities of AI. In accordance with existing literature, generative AI is especially unique in its applications because it allows for dynamic conversations that are based on context and can adapt in different ways to different users (Deng et al. 2024). Such improvements are vast differentiators from previous online educational materials and early stage chatbots. However, one reason why the results may not be overwhelmingly positive may be concerns or a lack of trust in AI generated content (Vieriu and Petrea, 2025). This study also provides a Non-American outlook on AI, but for Romanian university students. Nonetheless, our findings that show the average Likert score for Indonesian university students as close to or above 2.5 (the mean of the Likert scale indicating a neutral response) are corroborated by more general perceptions on the capabilities of AI. Finally, although student expectations of AI performance may be positive, existing research reminds us to be cautious of its implementation. Specifically, an article in the Educational Psychology Review discusses the possibility of inversion effects, which when AI can actually reduce cognitive processing and therefore diminish learning outcomes (Bauer et. al., 2025). Therefore, when discussing potential policies for Indonesian universities, policymakers must take care to balance both public opinion and theoretical risks of accurate AI performance.

Since our group’s goal is to find out how the adaptation of AI is impacting student education, looking at how many percent of students feel that their AI usage is positively impacting their learning can help us gain more insight on whether the AI tools can have a positive or negative impact on student learning. The majority of students in our dataset sample has answered positively that their AI tools support their individual learning styles and help them deepen their understanding, with 54.22% of students agreeing and 32.83% of students strongly agreeing on this sentiment. A minority of students disagree with this sentiment, with 10.13% of students disagreeing and 2.81% of students strongly disagreeing. The overwhelming majority of 87.05% of students seem to feel positive about AI tools supporting their learning styles, providing more detailed explanations, and helping them retain more information, which is supported by “Generative AI in Education and Research: Opportunities, Concerns, and Solutions.” by Alasadi and Baiz that states AI integration can positively support personalized learning materials that caters to individual student needs, and “The Quiet Transformation of Higher Education in the AI Era.” by Sejdiu et al. stating that AI tools could be used to create a more inclusive learning environment for students with various individual needs. More future research could be done to compare these self-reported sentiment from students and actual performance of students before and after using AI in a controlled experimental setting.
Challenges of Using AI
By exploring the relationship between students’ answers on how internet connection serves as a barrier and their geolocations, we could explore the potential implications of accessibility issues and equal opportunity issues that could create a gap between students who have the access to AI as opposed to those who don’t.
The provinces in darker blue color already showcase that they have a larger number of students with internet access who are interested in taking the online survey to answer questions related to AI usage in education. The provinces in lighter blue often had 0 or 2 students participating in the survey, with the possible implication that students in those provinces either did not have the interest in the topic of AI usage or that they had comparably less opportunities and access to the internet in the first place. There are some clear number differences of averages across different provinces, indicating potential socioeconomic differences by means of internet accessibility across Indonesia. In a literature review “The Impact of AI on the Future of Education in Indonesia.” by Fauziddin, Mohammad, et al., findings between 2014 and 2024 revealed that 60% of Indonesian students face difficulties due to lack of educational resources of high quality. Another finding from this paper concluded that only 30% of Indonesian schools have the internet capabilities necessary to support any technology-based or online-based learning. In this geographical map, students in upper left regions of Indonesia have the lowest average scores when it comes to having barriers with internet access, which could be an indication of differing privileges, socioeconomic status, and opportunities that AI adaptation could widen in the upcoming years. Adaptation of AI tools that are accessible only to students with reliable internet connections and resources could lead to a magnification of income and academic disparities in the future.
Attitudes Towards AI
In the ATU section, the regional averages show clear clustering. When we group the non-zero province averages into larger regions, Kalimantan ranks highest (avg = 3.16) and Java is close behind (avg = 3.08) both sitting above 3, which is a sign of a general lean toward agreeing that AI is preferable to purely traditional methods. Within these higher scoring regions, some provinces stand out as especially high, like Jakarta Raya (3.54), Kalimantan Barat (3.50), and Yogyakarta (3.13), suggesting strong acceptance of AI-supported learning environments. Sumatra is notably lower on average (avg = 2.50) and also more uneven it includes a very low score in Aceh (1.50), while other provinces like Bengkulu (3.50) and Sumatera Utara (2.76) are higher, producing a “mixed” regional picture rather than one consistent trend. The available eastern region values shown in the table are lower as well Papua (2.46) and Nusa Tenggara Barat / NTB (2.00) but it’s important to note these are each represented by only one province in the table, and several other provinces/regions are listed as 0 (likely meaning no respondents or no calculated mean for that province).
Analytically, these regional differences fit the project frame of “AI as a magnifier” in performance and accessibility issues because preference for AI often reflects whether students experience AI as reliable, helpful, and realistically usable in their learning context. The relatively high averages in Java and Kalimantan can be read as a sign that many students there may have the conditions that make AI feel like an upgrade, more consistent device access, stronger internet reliability, more exposure to AI tools, and/or more institutional normalization of technology in coursework. In contrast, the lower and more uneven averages in Sumatra especially the sharp drop in Aceh compared to higher scoring provinces suggest that the “AI classroom” is not experienced the same way everywhere; in some places, AI may feel less accessible, less trustworthy, or less compatible with how teaching and learning currently work. If universities move toward heavier AI integration, this uneven preference matters: regions where students already feel comfortable with AI may gain more from AI-supported learning and job preparation, while regions where students are less enthusiastic may face higher risk of being left behind or experiencing AI as an added barrier rather than a benefit. At the same time, because several provinces show 0 values (missing/insufficient data), the narrative should frame this as evidence of uneven adoption and uneven representation, and use it to justify why the project emphasizes regional inequality and accessibility not just whether AI helps, but who can actually benefit from it in practice and how it might change classrooms differently across provinces.
Perceptions of AI
This section analyzes students’ responses to the statement “AI can replace the role of teachers in the learning process.” The map shows the average responses by province on a Likert scale from 1 to 4, where 1 represents strongly disagree and 4 represents strongly agree. By examining the provincial averages, we can observe how students in different regions perceive the role of AI in the classroom.
From the map, most provinces fall around the middle of the scale. This suggests that students generally have mixed opinions about whether AI could replace teachers. In many regions, the average scores are close to neutral or only slightly above it, indicating that while students recognize the usefulness of AI tools, they are not fully convinced that AI should completely take over the role of teachers.
In the context of our project, these results suggest that students may see AI more as a supporting tool rather than a full replacement for teachers. AI systems can assist with explaining concepts, summarizing information, and providing additional learning support, but they may not fully replace the guidance and interaction provided by teachers in the classroom. This interpretation aligns with previous research suggesting that AI technologies can support learning while also having important limitations in educational contexts (Kasneci et al., 2023).
Motivations for Using AI
In the “Motivations for Using AI” section of the student survey, respondents answered five questions regarding their long-term retention of AI learning tools. Our analysis focuses specifically on the question: “plan to continue using AI as a learning tool”. This survey question relates to our team’s key research question as it allows us to assess province-level trends regarding the likelihood of AI remaining a fixture in future academic environments.
The geographic data reveals mean scores ranging from 2.0 (“Disagree”) to 3.85 (“Agree/Strongly Agree”). This variance suggests a significant regional divide in how students perceive the utility of AI. For instance, provinces like Aceh (2.0), Banten (2.38), Kalimantan Timur (2.0), and Riau (2.0) skew towards disagreement, which suggests that university students in these regions may not yet see the long-term necessity of AI or may feel less comfortable integrating these tools into their permanent workflows. Conversely, regions like Jakarta Raya (3.38), Papua (3.25), and Yogyakarta (3.26) demonstrate a clear inclination toward continued use. Students in these regions may appreciate AI’s ability to tailor individual educational experiences, as AI tools utilize data-driven algorithms to meet specific learning needs (Klimova and Pikhart). The optimism for the longevity of AI learning tools in some regions in our dataset corroborates the findings of a recent study by Chan and Tsi (2024) in another Asian country, where university students in Hong Kong showed a similar high degree of openness towards generative AI in their learning processes.
An important factor which can affect a student’s confidence, and thus affect their Likert scores for motivation using AI tools, is their “prompt-engineering” ability. Prompt engineering is defined as the ability to craft effective prompts in a LLM so that a quality prompt can be generated (Knoth and Tolzin). Student motivations for using AI tools may depend on their abilities to utilize them well or not, as this can affect their satisfaction with LLMs and their perceptions of the usefulness of AI tools in education. Furthermore, these regional disparities may be compounded by unequal access to high-speed internet, creating a “digital divide” where limited access hinders the development of the very skills needed to find AI tools useful in the long run.